Multi-tenant Real-time Game Chat — Fixing Write Bottlenecks Through Key Design
Platform Part lead · led server design, implementation, and load validation
2026-04-01 — present
A chat server designed to be shared by several games: channel-level Valkey sharding cut ACK p95 from 767.6ms to 6.6ms, and a dev load test held 20,002 CCU for 900s.
Performance Metrics
- ACK p95 (6K msg/s)
- Before: 767.6msAfter: 6.6ms
- Single node → 4-shard cluster
- Dev load held
- Before: 6,000 CCU targetAfter: 20,002 CCU · 900s
- 3.3x the target concurrency sustained
- Accept rate
- Before: 99.39%After: 99.994%
- 4,787 → 5,912 msg/s
- Outbox IteratorAge
- Before: 658sAfter: 35s
- 10-shard partition key
- Gateway command queue
- Before: 5,940After: 716
- Split connection pool · zero loss in 878,205 messages
Problem Solving
Under a fixed 6K msg/s load, a single Valkey node pinned EngineCPU at 99.9%, pushing ACK p95 to 767.6ms with an 80,000-entry WAL backlog. Valkey runs commands on one thread, so more cores would not help.
- Symptom: ACK p95 767.6ms at 6K msg/s · 80,000-entry WAL backlog
- Evidence: Single Valkey node EngineCPU 99.9%
- Root cause: Every write lands on one single-threaded node
- Fix: Channel-hash 4 shards · one hash tag keeps appends atomic
- Result: ACK p95 6.6ms · 99.994% accepted
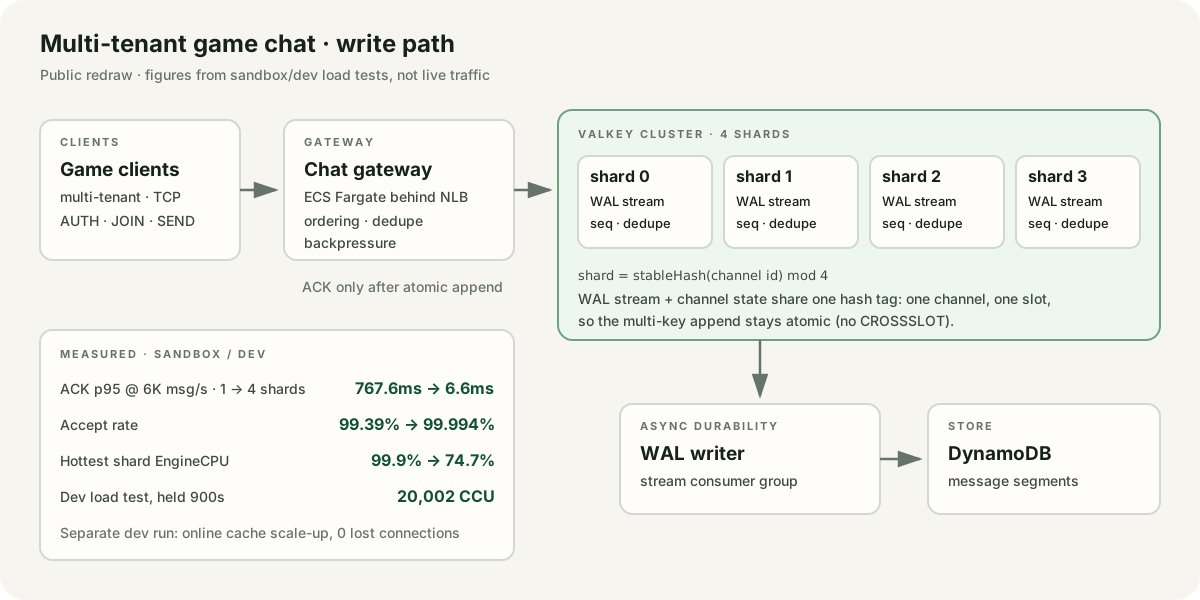
Picked the shard from a stable hash of the logical channel ID and gave the WAL stream and the channel's seq and dedupe keys the same hash tag, so a channel's multi-key append still completes atomically on one slot in a 4-shard cluster. A shard count of 1 keeps the legacy key shape.
ACK p95 767.6ms → 6.6ms, accept rate 99.39% → 99.994% (4,787 → 5,912 msg/s), WAL backlog 80,000 → 2,838, hottest shard EngineCPU 74.7%
The outbox Lambda sat at 2 concurrent executions (2% of its reserved 100) with zero throttles while IteratorAge stayed flat at 11 minutes. Tuning the batching window did not help.
- Symptom: IteratorAge stuck at 11 min · 2 of 100 concurrent
- Ruled out: Batching-window tuning · no effect
- Root cause: Partition key tenant#date put a whole day on one shard
- Fix: 0–9 suffix spreads writes over 10 partitions
- Result: IteratorAge 658s→35s · concurrency 2→8
Traced the cause to a tenant#date partition key that sent a whole day of writes to one partition and therefore one stream shard, then added a 0–9 shard suffix to spread writes across 10 partitions.
In a sandbox load run: IteratorAge 658s → 35s (−95%) and Lambda concurrency 2 → 8. When a 4K CCU run later showed 37K outbox-table write throttles, the outbox was removed in favor of stream CDC from the messages table.
Ordering accept slowed under hot-channel load, but the bottleneck could not be separated among Valkey Lua, the gateway event loop, the command queue, and topology.
- Symptom: Ordering accept slowed on a hot channel
- Evidence: Attribution metrics · fixed 500-CCU channel and staged load, cross-checked
- Root cause: One connection · saturated 0.5 vCPU event loop
- Fix: Split into a 4-connection pool
- Result: Command queue 5,940→716 · zero lost of 878,205
Added attribution instrumentation before changing anything, cross-checked ECPU per message, command queue depth, and event-loop delay under a fixed 500 CCU channel and staged load, narrowed the cause to one connection plus a saturated 0.5 vCPU event loop, then split the connection pool.
With a pool of 4: command queue 5,940 → 716, zero loss across 878,205 messages, sandbox verification 19/0/0
After the performance work, gateway tasks kept getting OOM-killed, and the first hypothesis (outbound queue buildup) was rejected when the validation run showed zero triggers.
- Symptom: Gateway tasks kept getting OOM-killed
- Ruled out: Outbound-queue buildup · zero triggers in the validation run
- Evidence: Heap snapshots · diagnostic logs · comparison runs
- Root cause: Observability retained heap · V8 limit vs 1GiB mismatch
- Result: No OOM kills after the fix
Registered hypotheses up front, then used heap snapshots, diagnostic logs, and A/B runs to separate retained-heap growth from the observability stack (statsd DNS lookups, hot-path instrumentation) and a mismatch between the V8 heap limit and the 1 GiB container memory.
OOM events dropped to zero after the fix
We needed evidence that connections hold beyond the 6,000 CCU target and survive a cache node scale-up.
- Evidence: 20K CCU load test in dev
- Result: 20,002 CCU held for 900s
- Evidence: Online Valkey node scale-up
- Result: No connections lost over 16m39s
Ran a 20K CCU load test in dev and, in a separate run, measured an online Valkey node scale-up.
Held 20,002 CCU for 900s. In the separate scale-up run, no connections were lost over 16m39s; 23 sends were rejected by backpressure and recovered through client retries.
System architecture
Scroll horizontally to view the full architecture. Select the diagram to open the original in a new tab.
Operating limits
Project Description
Clients connect to a TCP gateway, which acknowledges a message only after ordering, dedupe, and the WAL append complete atomically in Valkey. A separate WAL writer persists messages to DynamoDB through a Valkey Stream consumer group. Capacity targets (6,000 CCU sustained, 18,000 RPS, 90,000 RPS burst) were derived from a commercial game-chat solution's public rate limits and PCU basis, and every change followed the same order: instrument first, state a hypothesis, then compare measurements. Figures come from sandbox/dev load tests; the diagram is a public redraw without internal code or infrastructure identifiers.
Highlights
- Spread a single-node WAL bottleneck under a fixed 6K msg/s load across a 4-shard cluster: ACK p95 767.6ms → 6.6ms, accept rate 99.39% → 99.994%
- Shard key is a stable hash of the logical channel ID; the WAL stream and channel-state keys share one hash tag so the append stays atomic
- Replaced an outbox partition key that sent a whole day's writes to one partition with a 10-shard suffix: IteratorAge 658s → 35s
- Held 20,002 CCU for 900s in a dev load test; a separate run kept zero lost connections during an online cache scale-up
Tech Decisions
- ▶Sharding over vertical scaling: Valkey executes commands on one thread, so more cores do not relieve a write bottleneck. The trade-off is that a channel is pinned to one shard.
- ▶Logical channel ID as the shard key: in-channel ordering is a requirement, so routing is per channel, and the WAL and channel state share one hash tag to keep multi-key operations atomic.
- ▶Only the Valkey append happens before ACK; a separate writer persists to DynamoDB, separating client latency from database writes and letting the consumer group replay persistence.
- ▶ARM64: a same-load comparison at 6,000 CCU showed 15% lower CPU and 54% lower memory, and multi-platform images support both x86 and ARM64.
Lessons Learned
- •Write bottlenecks in a single-threaded store are solved with key design (sharding, hash tags), not vertical scaling.
- •A date-only partition key sends a whole day of writes to one partition; look at key design before tuning settings.
- •Changing things without instrumentation that separates the suspects leaves you unable to explain why it got better.