Database Saturation Root-Cause Analysis — Three Cases Fixed in Queries and Indexes
Platform Part lead · hands-on root-cause analysis, fixes, and recurrence guards
2026-04-01 — 2026-06-30
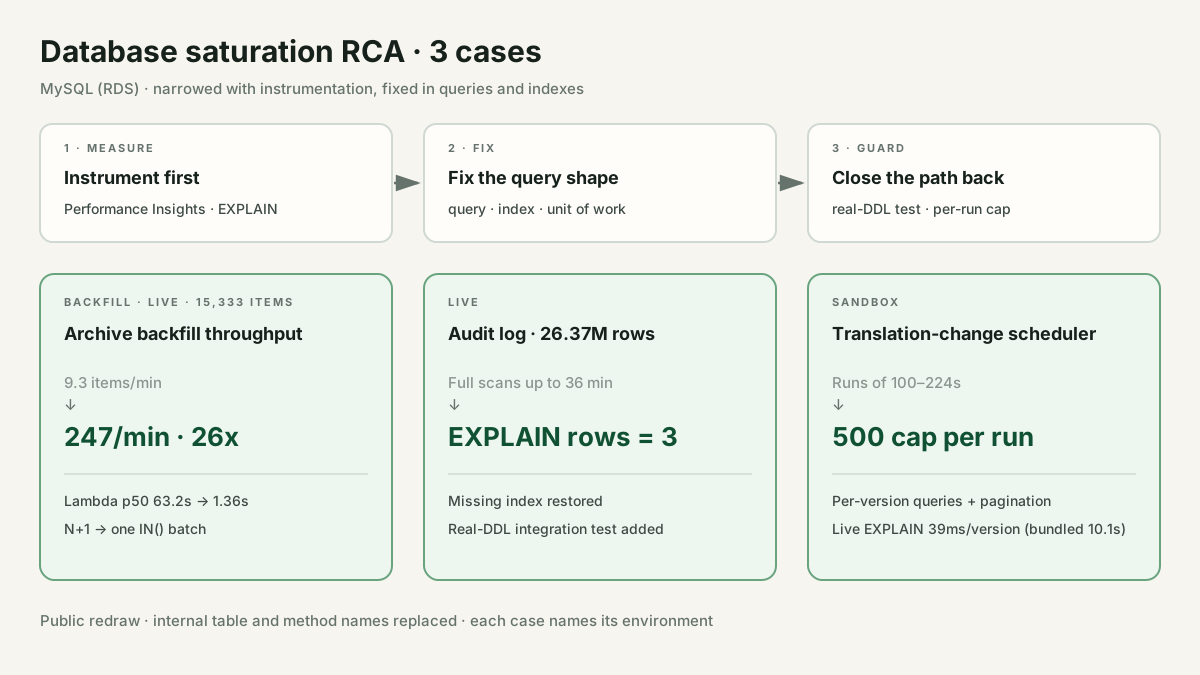
Traced three RDS CPU/IO saturation cases to the offending query with Performance Insights and EXPLAIN: backfill throughput up 26x (9.3 → 247 items/min), and full scans of up to 36 minutes on a 26.37M-row audit log removed (EXPLAIN rows = 3).
Performance Metrics
- Backfill throughput
- Before: 9.3 items/minAfter: 247 items/min
- 26x · 15,333 completed, 0 pending
- Lambda run (p50)
- Before: 63.2sAfter: 1.36s
- p99 67.0s → 2.99s
- Audit-log query (live)
- Before: Full scans up to 36 minAfter: EXPLAIN rows=3
- Index restored and declared on the entity
- Translation detection run (sandbox)
- Before: 100–224s · overlapped the 10s intervalAfter: Per-version queries · 500 cap per run
- Live EXPLAIN: 39ms for one version (bundled 10.1s)
Problem Solving
During a marketing-metrics archive backfill, Lambda runs took 63s and throughput sat at 9.3 items/min, putting the remaining work at a 15-hour ETA. The first hypothesis was a large (540MB) bulk-insert transaction, but RDS CPU was pinned at 99.8%.
- Symptom: CPU 99.8% · 9.3 items/min · 15h ETA
- Ruled out: Hypothesis: 540MB bulk-insert transaction
- Evidence: Performance Insights: one read query, 99.5% of load
- Root cause: 30-day N+1 · DATE() bypasses the index · full-column select
- Fix: One IN() batch · direct date compare · needed columns only
- Result: 247 items/min (26x) · p50 63.2s→1.36s
Performance Insights showed 99.5% of the load coming from one query that looked up the latest result per day. It combined an N+1 loop over 30 days, a DATE()-wrapped date condition that could not use the index, and a select of the full compressed result column. I replaced it with one IN() batch for the 30 days, direct date comparison, and a minimal column list, then picked the latest version per day in memory. Bulk inserts were also split into chunks of 500.
Lambda p50 63.2s → 1.36s (p99 67.0s → 2.99s), throughput 9.3 → 247 items/min (26x). The backfill finished with 15,333 completed and 0 pending, and once the work was done RDS CPU sat idle at 5–7%.
Each open of the audit-log screen in the live console full-scanned a 26.37M-row, 27GB table; four concurrent queries piled up for as long as 36 minutes, saturating IO and delaying INSERT commits.
- Symptom: 26.37M-row full scans · up to 36 min · IO saturated
- Evidence: Traced how the composite index vanished
- Root cause: An auto-generated migration dropped the undeclared index as drift
- Fix: Declared on the entity · 27GB DDL prebuilt off-peak
- Result: EXPLAIN type=range, rows=3
Tracing why the composite index on the parent-ID condition had disappeared showed that an earlier auto-generated migration treated it as drift, because the entity never declared it, and dropped it. The recovery migration's CREATE INDEX also had an ALGORITHM/LOCK syntax error. I declared the index on the entity so it cannot be dropped again, built the 27GB index with online DDL in a low-traffic window first, and made the deploy migration a no-op when the index already exists.
Confirmed the index exists on live and the migration is recorded; EXPLAIN changed to type = range, rows = 3, ending the full-scan incident. An integration test that runs the real DDL was added.
In sandbox, a translation-change detection scheduler saturated DB Read IOPS at 190–470/s (normally under 10/s); login handling exceeded 10 seconds, hit the load balancer timeout, and some users could not log in for about 60 seconds.
- Symptom: Read IOPS 190–470/s · some users unable to log in for ~60s
- Evidence: 10s interval, 100–224s queries · runs overlap
- Root cause: One IN over 159 versions forced a full scan
- Fix: Per-version query · pagination · 500-per-run cap
- Result: Bounded run length · total query time barely drops
The scheduler bundled 159 versions into one IN condition and full-scanned the translation word table (3.27M rows on live); it ran every 10 seconds while each query took 100–224s, so runs overlapped and piled up. I ported the per-version pattern from the AI translation detector, running one query per version with pagination and a 500-request cap per run to bound each run. The fix shipped as a shared-package release, and applying it to the game server was checked for backward compatibility with a byte-level comparison of 1,073 fields.
On live EXPLAIN, the per-version query took 39ms for one version, while the old bundled query over 159 versions took 10.1s. Running every version does not shrink a run's total query time much, so the real fix is that pagination and a per-run cap bound the length of each run. All integration tests passed.
Operating limits
Project Description
Three saturation cases on MySQL (RDS), across a marketing-metrics service and a game server, handled in the same order: identify the query creating the load with instrumentation first, fix the query shape, index, or unit of work, then close the path that would bring the problem back. One was a live incident, one a sandbox incident, and one a bottleneck during a large backfill; each item names its environment. Internal identifiers such as table and method names are replaced with generic names.
Highlights
- RDS CPU pinned at 99.8% during a backfill: Performance Insights put 99.5% of the load on one read query; removing its N+1 pattern and DATE() index miss raised throughput 9.3 → 247 items/min (26x) and cut Lambda p50 63.2s → 1.36s
- Live incident: an index dropped as drift by an auto-generated migration left a 26.37M-row audit log open to full scans of up to 36 minutes; after restoring it, EXPLAIN shows rows = 3
- Sandbox incident: a 10-second scheduler bundled 159 versions into one query that ran 100–224s, overlapped itself, and saturated Read IOPS at 190–470/s; per-version queries and a per-run cap now bound each run
- Recurrence guards: declared the index on the entity so it cannot drift away, and added a real-DDL integration test and a 500-request cap per run
Tech Decisions
- ▶Measurement over hypothesis: the backfill was suspected of a large transaction, but Performance Insights pointed at one read query, so the fix went to the read query's shape, not the write path.
- ▶Declare indexes on the entity: an index that exists only in a migration can be dropped as drift by the next auto-generated migration, so the entity is the schema source of truth.
- ▶Keep the 27GB online DDL out of the deploy: build it manually in a low-traffic window, and let the deploy migration skip an existing index, so no long DDL runs during a deploy.
- ▶Cut periodic work small: per-version queries, pagination, and a per-run cap bound the length of each detection run.
Lessons Learned
- •A first hypothesis stays a hypothesis until measured; the query behind 99.5% of the load was not where I first looked.
- •An index that lives only in a migration can vanish as drift at any time; keep the schema source of truth on the entity.
- •Periodic jobs pile up the moment one run outlasts the interval; split the unit of work and cap it.